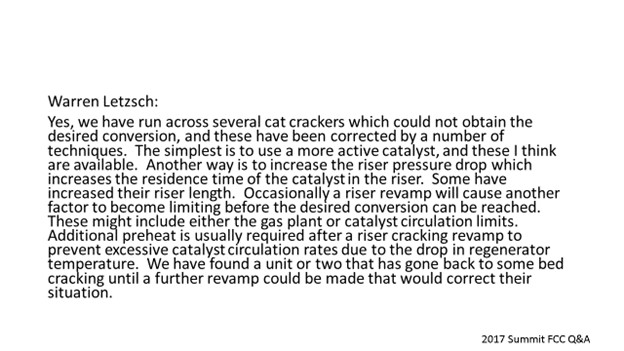
Question 56: 1973 FCC Process Question 13: When an older cat cracker is modified to incorporate riser cracking, has anyone encountered a limitation on the amount of conversion that could be obtained? In order to achieve maximum conversion, has anyone found it necessary to return to using a limited level of bed cracking?
FEDERSPIEL (W.R. Grace & Co.)
I would like to call on Warren Letszch who was on that panel in 1973. He can cover the historical answer and provide us with any updates, if available.
WARREN LETSZCH (TechnipFMC Process Technology)
Yes, I do remember that panel. It was at the Hyatt Regency Hotel in Houston, Texas, and there were about 700 people in the audience. In those days, we had about 1300 people coming to the meeting.
Let me put this question in context for you. The biggest advancement in catalytic cracking was the advent of the zeolite catalyst. That started in fluid units really in about 1965. By 1970, 30% of the units were still running amorphous cracking catalysts. Now just to give you a nickel’s worth of background here: All cat crackers built with amorphous catalyst were basically designed in the early days to have anywhere from a minimum of 50% recycle up to 100% recycle.
Why do you suppose we call it ‘light cycle oil’ and ‘heavy cycle oil’? Many units were designed with two risers, and the risers were equal: One was a recycle riser, and one was a fresh feed riser. The zeolites were at least – in order of magnitude – more active than the cracking catalyst we were using. In fact, if you want to think about our own operations today, think about running an activity level of about 40 on your catalyst versus the 65 or 70 or whatever you are running. Most of the units were designed with a space velocity of about two, so there was as much catalyst in the reactors as there generally was in the regenerator. When the zeolitic catalysts came out, everyone was anxious to put in the FCCU and see what was going to happen.
You currently use cracking catalyst that typically contains anywhere from 25 to 35 wt% (weight percent) zeolite. The very first cracking catalyst that came out in 1965 to around 1970 contained anywhere from about 3.5 to 7 wt% zeolite; so, by 1973, a high level was 12 wt%. So, what did people do? They put the zeolite catalyst into the unit. In some cases, the catalyst did not work; in others, it did. We discovered three things that were important in the operation. First, we had to cut down the residence time of the catalyst in the reactor. With a two-space velocity, the catalyst could be in the reactor for five minutes or more. With the riser cracker, of course you cut it down to seconds. We also found out that paraffinic feeds worked very well. Aromatic feeds were not all that great. And guess what? We learned that carbonium ion mechanism does not allow the cracking of aromatics.
The other critical thing was the carbon-on regenerated catalyst. We found that the carbon on the regenerated catalyst had to be below 0.3 wt%, and preferably down to at least 0.2 wt% to work. Quite simply, the residual coke left on the catalyst is all associated with the zeolite, not with the matrix. A couple of years ago, I presented a paper about this at the Annual Meeting. In it, I explained that with about 7% coke on the zeolite, the zeolite will not work anymore. Early FCCUs were designed for as much as 0.5% carbon on regenerated catalyst. Why? Because there was not any real benefit, as far as activity on the old amorphous high-alumina cracking catalyst. Also, you have to remember that we all had carbon steel. We had partial-burn regenerators. There were units that ran 1050°F in the regenerator. A really high temperature was 1150°F. At 1200°F, you were getting nervous. At that point, people would put water sprays up there to protect the carbon steel cyclones.
So, this was really the advent of high-temperature regeneration and where riser cracking became the norm. At that time, some refiners went to a riser cracker and could not get all the conversion they wanted. A lot of them got it just by dropping the bed level in the reactor and just letting the riser come up. In some cases, they would have to go back to the reactor bed.
But if you did not have enough activity, the easiest fix was just to add more catalyst or go to a catalyst with a higher zeolite concentration. The riser pressure drop is a way to create more catalyst contacting. That was not really the best solution; but occasionally, it would happen. Then the question came down to whether or not, in the revamp, you caused another limit on the unit that was really not related to the reactor performance. I have news for you: Some of these people could not handle all the gasoline in the gas plant. Suddenly, you are running your FCC unit and the gasoline yield goes up 8% on fresh feed. Your debutanizer may not be able to handle that much. It was a problem that refiners were happy to have. So, yes, we did find a few people that went back to bed cracking. That is basically the answer I gave and the history behind it.
ROBERTSON (AFPM)
Thanks, Warren. I think you said more words than were up there on your slide. [Laughter]
MALLER (TechnipFMC Process Technology)
I will be brief with my response. I find it interesting to hear some of the history that was certainly before my time, especially because TechnipFMC now has a process that – although relatively new compared to 1973 – is employing the same technology and concepts mentioned in the question: bed cracking. We have a process which is using a riser that distributes catalyst and reactor effluent into a bed to continue the cracking reactions. We use that bed cracking to get additional residence time so we can get additional conversion of the naphtha that is generated in the riser and convert it to LPG. This process is intended for on-purpose petrochemical feedstock production. We are able to produce LPG yields over 40%, with half of that being propylene. This particular bed cracking method is also able to produce a relatively high percentage of ethylene.
BOB LUDOLPH [Shell Global Solutions (US) Inc.]
I would like to poll the audience. How many of the people here work for companies that continue to operate bed crackers? [No response] Wow! Shell is one. [Laughter]
MELVIN LARSON (KBC Advanced Technologies, Inc.)
KBC has seen a number of units that were built in the 1960s and 1970s that have gone up to such high conversion levels that water removal is no longer achievable in the overhead receiver. We see a lot of naphtha streams that are supersaturated with water going into primary and secondary absorbers, so we know of many places that have been expanded hydraulically and through conversion. The original equipment will just not get the water separation you really need to run a dry, safe gas plant. You will get H2S and all kinds of nasties in the absorber systems. So, you should check for water content or saturation, looking for your contaminant levels to see if you have tower problems. If you can get the water out, you will actually get a whole new gas plant.
ROBERTSON (AFPM)
Thank you. And thank you, Warren.
ALEX MALLER (TechnipFMC Process Technology)
Technip has a process in which a combination of riser cracking and bed cracking is used to maximize conversion. We have found that there are limits to the conversion that can be achieved in traditional riser cracking. By adding the bed cracking, we are able to supply additional residence time and catalyst/vapor contact with which to complete the conversion of naphtha to LPG. With this process we are able to attain LPG yields well in excess of 40% with a variety of feedstocks. Maximum conversion is achieved with feeds that are very rich with hydrogen, which could be hydrotreated VGO (vacuum gas oil) or even hydrotreated atmospheric tower bottoms.
Year
2017
Process
Question 50: From this list of your top FCC gas plant constraints, which area is your primary constraint: 1) main column (MC) overhead, 2) wet gas compressor, 3) primary or sponge absorber, 4) stripper, or 5) debutanizer bottoms or overhead?
ERIN CHAN and SUZY ANDERSON (Burns & McDonnell, Oil, Gas & Chemical (OGC)]
Refining investments in alkylation expansions and gasoline octane improvements require production of additional feedstock for the alkylation unit. The primary source of olefin feedstock for the alkylation unit is the FCC unit. Operating conditions in the FCC unit can be adjusted to favor increased propylene and butylene production. The FCC wet gas compressor becomes the first major bottleneck in recovering the incremental propylene and butylene. Modifications may be required to the compressor, as well as associated cooling, inter-stage, or after-stage equipment.
Downstream of the FCC wet gas compressor, absorption or sponging capacity becomes the next bottleneck. Increased lean or sponge oil circulation, as well as additional cooling or chilling, can be used to separate the propylene and butylene from the fuel gas stream. Alternately, a cryogenic type processing unit can be used to cool the fuel gas stream and produce a liquid C3+ product stream. Downstream of the absorption and sponging columns, the depropanizer and debutanizer columns may be pushed to their limits, with the overhead condensing systems becoming a bottleneck in recovering the liquid propylene and butylene products.
Year
2017
Process
Question 51: Can you comment on the safety aspects of placing catalyst in a standpipe to help isolate one vessel from the other? Does the existence of catalyst in a standpipe create a ‘seal’?
TRAGESSER (KBR)
I would like to mention that we will have a P&P tomorrow on this topic, so I will try to keep my answer short. It is assumed that this question relates to using the slide or plug valve to form a seal between the regenerator and the reactor during shutdowns. I would like to point out that this is a standard practice in an FCC as there is really no other option; and for the most part, it does work.
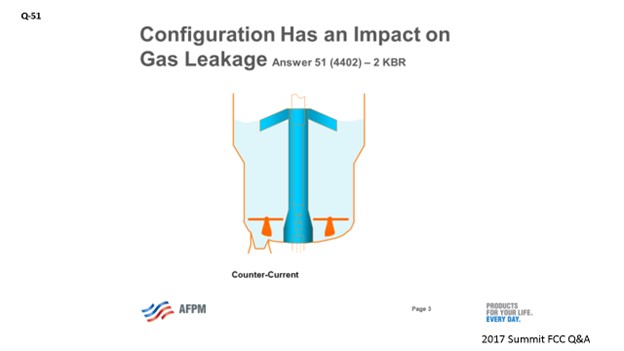
However, unit configuration – specifically what is on the downstream side of the valve – has an impact on how reliable the seal will be. Having catalyst on both sides of the valve is the ultimate scenario to minimize gas leakage from one vessel to the other, even if there is a negative pressure differential.
Shown here is one example of a stacked KBR unit where the spent catalyst plugs valve discharges into a well in the regenerator that always has catalyst in it. In most cases, the well is usually fluidized by steam. For this configuration, even if the pressure differential went negative (meaning, the downstream pressure is higher than the upstream pressure), at most, you would only get a small leakage of steam going backward up the spent catalyst standpipe. As you can see, in this configuration, it would not be possible for air to get into the reactor side of the unit as long as there is a normal catalyst level in the regenerator.
Another example is an older side-by-side unit where the spent catalyst line enters the freeboard side of the regenerator. With this type of configuration, there is more risk for air to leak back into the reactor as there is not a very good catalyst seal on the downstream side of the slide valve.
In all FCC units, the key to minimizing air leakage into the reactor is to ensure that the reactor pressure is above that of the regenerator pressure during periods when oil is out of the unit and there is no catalyst circulation.
Year
2017
Process
Question 52: What challenges do you face for implementing safety-instrumented systems that result in closure of the FCC slide valves?
FOOTE (CHS Inc.)
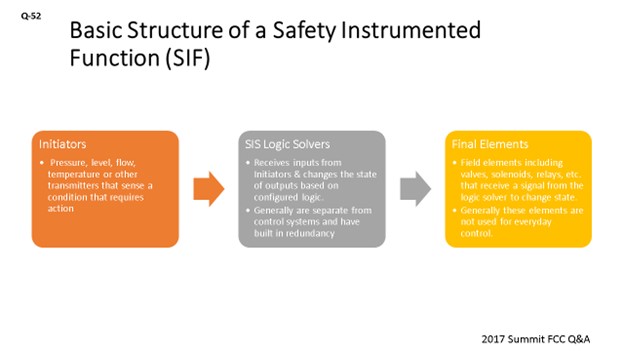
Safety-instrumented shutdown systems have been used in many refining processes. Regardless of whether it is applied, the basic structure of a safety-instrumented function is as follows: First, there are initiators. These are pressure, temperature flow, or level transmitters that sense a condition that requires some type of action. These transmitters can also be used for control, but they should be hardwired to the SIS (safety-instrumented system) and then passed through to the control system. The second piece is the SIS logic solvers. These are electronic hardware that receives information from sensors which change the state of the outputs based on the configured logic. These systems are separate from the normal everyday control. Typically, these systems have built-in redundancy to improve reliability. The third piece is the final elements. These are the elements – including valves, solenoids, or relays – that receive the signal from the logic solver and then change the state. Normally, these are not the same elements that are used in everyday control; that is, you have a control valve, and then you have a chop valve downstream of it.
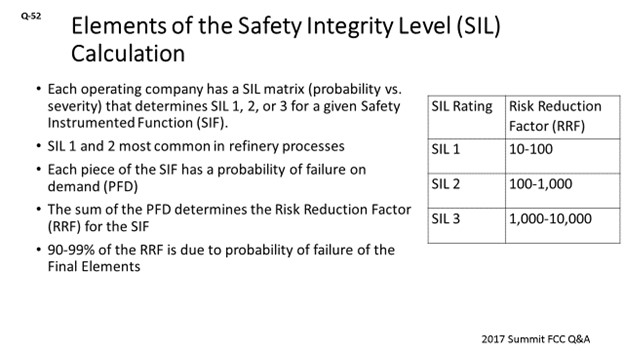
Each operating company has a safety integrity level (SIL) matrix that, basically, has probability on one axis and severity on the other axis to determine if SIL 1, 2 or 3 is required based on the hazard associated with the pertinent safety instrument and function. So, each functional piece of the safety-instrumented function has a probability of failure on demand, and the sum of the probabilities of failure on demand gives us a risk reduction factor. The table on the right side of the slide shows the risk reduction factors required for each of the different SIL ratings. SIL 1 and SIL 2 are the most common ratings in the refining industry. For example, I think we only have one SIL 3 to safety-instrumented function in our refinery and it is not in the FCC.
Breaking down the probability of failure on demand based on the functional piece of the safety-instrumented function are the sensors. Two-out-of-three voting is generally configured, so not all sensors need to be functional. Pressure transmitters can get plugged out, but they are generally reliable. Also, the hardware and logic have built-in redundancy, so they are very reliable, too. It is the final elements, though, that sit in one state and are then required to change that state. Many times, four out of four valves – or five out of five valves – are required to close to bring the unit to a safe state. Therefore, 90 to 99% of the risk reduction factor is due to the probability of failure on demand of the final element. So, if you are trying to improve the risk reduction factor to get to the SIL rating you need, you should concentrate on the final elements.
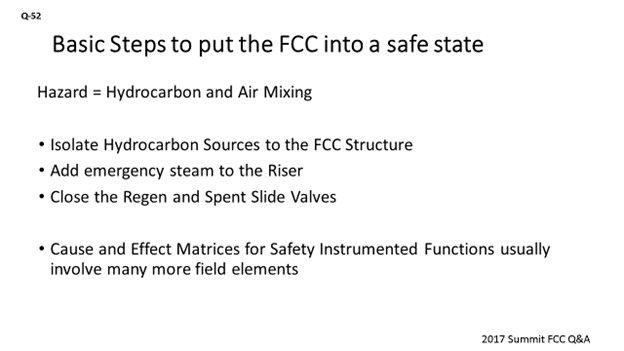
The hazard associated with an FCC is obviously hydrocarbon and air mixing. The basic steps to put the FCC into a safe state are: First, isolate the hydrocarbon sources of the FCC structure; then, add emergency steam; and finally, close the regenerated and spent slide valves to stop circulation. It is important to also realize that your cause-and-effect matrix might have many different functions. You might trip compressors, close MOVs (motor-operated valves), or pulse controllers to 0% output, for example. Not all of those functions are part of the SIL calculation, but they are the essential pieces.
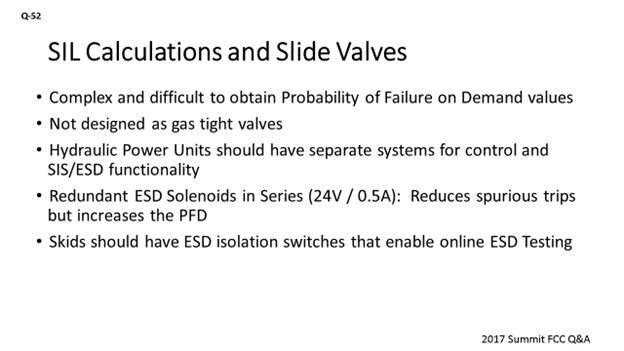
For slide valves, there is some complexity when it comes to SIL calculations. First of all, there are complex pieces of equipment that comprise the slide valve system. You have accumulators, solenoids, and other components that make it very difficult to obtain probability of failure on demand values for these valves. Also, realize that these valves are not gas-tight valves. We should always assume that they leak. So, it is only through isolation of hydrocarbon, adjusting the pressure balance, and the introduction of steam that we are able to control what and how much leaks from these valves. Modern hydraulic power units should have separate systems from an SIS and the ESD (emergency shutdown device) for control and functionality. As I said, your ESD accumulator is separate from the control accumulator and all the controls. Most ESD systems rely on redundant solenoids – or most slide HPUs’ (hydraulic power units’) redundant solenoids – to get full hydraulic accumulator pressure to close the slide valve. They do this very quickly, usually within five seconds. The series arrangement of the solenoids decreases the spurious trips but increases the probability to failure on demand, because both of those solenoids have to open. So, it is important to account for the configuration when calculating the PFD (probability of failure on demand) for that slide valve. Also, your skid should have an ESD isolation valve which will allow you to test those solenoids online; because in my opinion, the most common failure for these slide valve skids is probably the solenoid not opening. Next, realize that your SIL hardware has limits. You can only power it to 0.5 amps. If you exceed those power limits, you will then need to consider the external power source in your probability of failure.
Next, I will discuss the options for getting your slide valves to pass a SIL calculation. First, remember that the hazard is hydrocarbon and air mixing. So, if you can isolate hydrocarbon and add emergency steam as your SIL 1 function, hydrocarbon has removed from the riser and the hazard potential is reduced. The closure of the slide valve and other actions from the cause-and-effect matrix can be considered as a SIL 0 function.
A second option is partial stroke testing. Valves and ESDs are partially stroked at regular intervals to confirm that they are working, and that the procedure is being documented. The SIS valve positioners on control valves can actually do that automatically and record it. It is important to note that with partial stroking, you can get a ‘slide valve to safety-instrumented’ function that involves the closure of the two slide valves to pass. But typically, you have to do partial stroke intervals of about four to eight months or so.
The third option is to focus on redundant series chop-out. You need to make sure that your hydrocarbon sources move from a one-out-of-one opening or closing to one-out-of-two. RRF is improved if you have this. It is relatively easy to apply the approach to hydrocarbon control valves, but it is very hard to do it to slide valves.
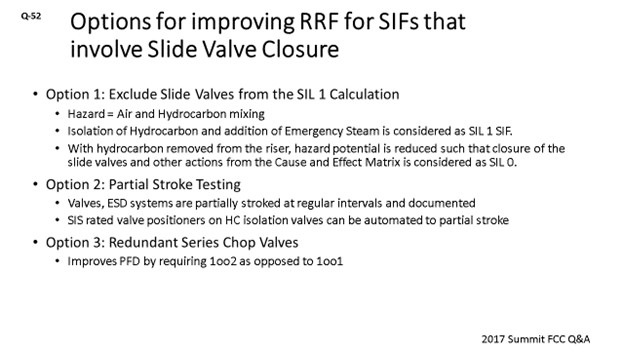
Some refiners have the luxury of having two slide valves in their standpipe, so they can operate one out of two and close the other as needed. However, most refiners only have one valve at their disposal. Within CHS, we consider the isolation of hydrocarbon to the FCC structure and introduction of steam to the riser as the SIL 1 function. The closure of the slide valves is an SIL 0 function. We do have design standards for hydraulic power units and try to meet these Best Practices, as we discussed earlier. Within the past five years, both of our FCCs have been upgraded to the right HPU and actuator systems to meet these standards when we have used two different HPU manufacturers.
DINKEL [Marathon Petroleum Corporation (MPC)]
I agree with what Darin just said, as far as the details and where to put the unit in a safe state. But within Marathon, we have taken a little different approach by following RAGAGEP (Recognized And Generally Accepted Good Engineering Practices) and defining that within our own internal application standard. We are specifying what interlocks are required on our FCCs without necessarily having to go through the full LOPA (Layers of Protection Analysis) process on those interlocks. We do specify individual components to be designed, installed, and tested on a frequency that is higher, as if it is a higher integrity SIL.
I want to point out that we also follow a “trust but verify” approach. Procedurally, we require that if we have a unit trip, Operations must go out within a very short period of time to verify that 1) the valves that are supposed to close have closed (e.g., slide valves) and 2) other items have opened as intended, such as the emergency steam valve to the riser.
MALLER (TechnipFMC Process Technology)
I agree with both of the responses so far. From a design perspective, at TechnipFMC, we do not consider the slide valve closure as the final element in the safety system. We require that parallel actions occur that put the unit in a safe place. There is also the critical step of having someone go in the field and verify that the valve is closed; or if not, make it close.
J.W. “BILL” WILSON (FCC Consultant)
I have a question about partial stroke. If anyone on the panel or in the audience does that, how far do you stroke the slide valve? I mean, the slide valves are unique in that they are one of the few places where your regular control valve is also your isolation valve. If you do partial strokes, how far do you stroke them?
FOOTE (CHS Inc.)
I can answer that question. We do not really partial stroke. All we do is test the ESD (emergency shutdown). If those ESD solenoids open, you will get full hydraulic accumulated pressure to that actuator. It will close the valve. So, we do not do a partial stroke, in the sense of removing the valve. We are just isolating the hydraulics when testing the solenoids so they will open.
W. LEE WELLS (LyondellBasell Industries)
We are one of the lucky refineries whose FCCU has dual slide valves; so, we partially stroke with one while we control with the other one, and then we swap them. We stroked the slide valves enough to still have the same pressure differential. We end up closing it down to somewhere around 40 to 50% open.
I will also just echo the comments about the field verification because we have experienced our feed MOV not closing completely when it was activated, as have some other sites I know. The feed MOV is supposed to trip and take the feed out of the riser. If it does not happen, you will end up filling up your riser with oil. That is a bad situation to be in. So, definitely put field verification on your list.
WARREN LETSZCH (TechnipFMC Process Technology)
I am curious. When you have a high temperature excursion in the regenerator around 1600°F and everything gets hot, does anyone worry about whether the guides in the slide valves might get warped. Do you check the slide valves after such an excursion, or do you just hope everything is right? Or is this not a problem with any of your designs?
FOOTE (CHS Inc.)
We have not had any shutdowns associated with high temperature yet, but we do have temperature initiators in the regenerator. I think at 1500°F, we have an hour to get it lower. At 1600°F, there is an immediate stop in the circulation. We have had a couple of excursions. We did not really check the slide valves, because they seem to work okay.
TRAGESSER (KBR)
I will just add that in the scenario you just described, the low slide valve pressure differential would trip and close the slide valve. If you have flow reversal, you will then get a chance to see if the slide valve works.
DARIN FOOTE (CHS Inc.)
Safety-instrumented shutdown (SIS) systems are used in many refining processes. Regardless of the process or equipment where it is applied, the basic structure of a safety instrument system includes:
-
Initiators (Sensor Devices): These are pressure, level, flow, temperature, or other transmitters which sense a condition that requires action.
-
SIS Logic Solvers: This is the electronic hardware that receives information from the sensors and changes the state of outputs based on configured logic. These systems are separate from the controllers and hardware used in everyday control. Typically, these systems have built-in redundancy to improve reliability.
-
Final Elements: These are field elements including valves, solenoids, relays, etc. that receive a signal from the logic solver. Normally, these elements are not the elements used for everyday control, i.e., the control valve (everyday control) would be in series with a chop valve (SIS).
Systems are designed to meet a specific safety integrity level (SIL). Each operating company has a risk-based matrix specific to the company or site. This matrix has severity on one axis and probability on the other axis. High severity and high probability score the highest. Based on this ranking system, the company sets the SIL rating at SIL 1, 2, or 3. SIL 1 and 2 are the most commonly found in typical refinery processes. SIL 3 is the highest and is not common to refinery applications. The hazard analysis (HAZOP, PHA, LOPA, etc.) establishes the required SIL for each safety-instrumented function (SIF).
SIL varication calculations are required to ensure that the hardware used in each SIF has the capability to achieve the required SIL from the hazard analysis. The result of these calculations generates a risk reduction factor (RRF). The RRF is dependent on the probability of failure on demand (PFD) of all the components in the system.
Table 52-1 lists the industry-required safety-instrumented risk reduction factors (RRF) for the three major SIL ratings.
Table 52-1. RRFs Required to Achieve Various SIL Ratings
|
SIL RATING |
RISK REDUCTION FACTOR (RRF) |
|
SIL 1 |
10 - 100 |
|
SIL 2 |
100 - 1,000 |
|
SIL 3 |
1,000 - 10,000 |
Figure 52-1 illustrates a scenario for a typical slide valve pressure differential interlock protecting the Rx/regen (reactor/regenerator) system from hydrocarbon and air mixing should a pressure reversal occur. In this example, the SIL calculation only considers removing hydrocarbon from the Rx/regen system to mitigate the risk of explosion. Specifically, removal of hydrocarbon is considered an SIL-rated function and the closure of the slide valve(s) and addition of emergency steam is not SIL-rated. Three pressure transmitters monitor the dP (∆P; delta pressure; pressure differential) across the slide valve. If 2oo3 logic senses a low pressure, the logic solver will send a signal to four final elements to block in hydrocarbon flows to the Rx/regen system. For this example, the interval of testing is 54 months.
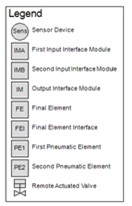
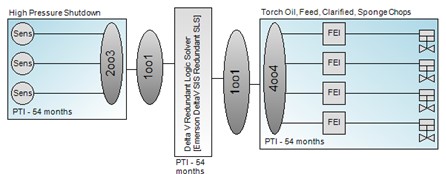
Figure 52-1. Safety-Instrumented Function - Low Slide Valve dP
Figure 52-2 is a graphical representation of the percent contribution to PFD based on functional pieces of the SIS system shown in Figure 52-1. As shown, most of the failures on demand are due to failure of final control elements. In this example, all four valves must close to mitigate the risk of explosion. This 4oo4 action results is a high likelihood of failure on demand.

Figure 52-2. Probability of Failure on Demand Contribution by Functional Piece
To improve an SIL rating, we must improve the PFD for the final elements, which can be done in two ways. First, adding partial stroke testing intervals to these essential elements can verify that the valve is functioning properly. If partial stroking is practices at intervals during the run, then the PFD will go down and the RRF will go up. Second, adding redundant chop valves brings this to 1oo2oo4, which increases the RRF. Table 2 shows the cumulative effect of both of these changes to the base configuration shown in Figure 52-1.
Table 52-2. Ways to increases Risk Reduction Factor (RRF)
|
|
Base Case: 4oo4 valves closing |
4oo4 valves closing with partial stroke testing |
1oo2oo4 (Redundant chop valves in series) |
|
PFD Average (Sensor) |
5.23e-04 |
5.23e-04 |
5.23e-04 |
|
PFD Average (Logic Solver) |
2.51e-04 |
2.51e-04 |
2.51e-04 |
|
PFD Average (Final Element) |
9.13e-02 |
5.38e-02 |
1.20e-02 |
|
Achieved RRF |
11 |
18 |
78 |
|
SIL Rating Achieved |
SIL 1 |
SIL 1 |
SIL 1 |
The example shows the difficulty of using normal control elements as functional pieces of SIS logic. Slide valves present a particular challenge to these calculations due to their complexity of components. The Best Practice is to design slide valve hydraulic systems such that the valves have an SIL 1 rating, regardless of whether or not they are included in the SIL calculation. If slide valves are included in the SIL calculation, the following should be considered when determining the PFD of slide valves:
-
Actuator Hydraulics: The control side of the hydraulic skid and SIS/ESD side should be separate with independent hydraulic accumulators.
-
Redundant Solenoids: Solenoids are typically used as the final element to send full-system hydraulic pressure to close the slide valve. HPU manufacturers often put redundant solenoids in the hydraulic ESD configuration. Though this reduces spurious trip potential, it increases the PFD as both solenoids are required to change state to initiate the ESD sequence. Also note that logic solver outputs have power limitations, so power injection or interposing relays may be required to properly actuate the solenoids on the HPU skids. This situation introduces another point of potential failure.
-
Provisions should also be made to perform ESD testing of the slide valve skid on the run. This practice has the same effect as partial stroke testing of a chop valve, typically requiring SIS logic, as well as an ESD bypass valve at the slide valve skid. Generally, partial stroke testing intervals of six to eight 8 months are required to achieve an RFF of 10 – which is required for an SIL 1 rating – on a 54-month test interval.
-
Slide valves are not designed to be gas tight when shut off. The best-case scenario is a catalyst tight shutoff. However, the reality is that during the run, even a catalyst tight shutoff is difficult to achieve.
In summary, as a company, you should carefully examine your cause-and-effect matrix for SIS. Reduce the resultants to a few essential actions to mitigate the risk. Once the number of elements is reduced, focus on these final essential elements to improve your risk reduction factor.
BRYAN DINKEL [Marathon Petroleum Corporation (MPC)]
The fundamental key to placing an FCC into a safe state during a trip is to keep the hydrocarbon and air separated. In order to accomplish this division, isolate hydrocarbon (feed) sources, stop catalyst circulation, and introduce steam to the riser. Isolation valves with tight shutoff ratings for the feed are standard offerings from valve suppliers. Reliable solenoid valves and proper system designs ensure that steam valves will open, and hydrocarbon valves will close on demand. Valve suppliers can provide probability of failure on demand (POFoD) numbers from industry-published documentation for use in evaluating an SIS (safety-instrumented system) with the LOPA.
The third component of putting the FCC into an isolated state is the slide valve, which is a complex piece of equipment that provides a challenge for getting a POFoD. Slide valve manufacturers hesitate to provide this number due to the fact that the numerous components in the valve and actuator system can fail. Within Marathon Petroleum Corporation, we utilize the Recognized and Generally Accepted Good Engineering Practice (RAGAGEP) approach pertaining to slide valves, relying on licensor expertise and industry experience. As such, we designate trips involving the slide valves as interlocks. We do require design of all components to be SIL-1 or higher and to have a required closing time of less than 30 seconds. We also require a field verification step to confirm that the feed is isolated, and the slide valves have moved to the fully closed position.
ALEX MALLER (TechnipFMC Process Technology)
Slide valves are critical for the safe and reliable operation of most FCC units. Generally, when they are required to close, it is to prevent the mixture of hydrocarbons and oxygen, either from hydrocarbon ingress into the regenerator or air ingress into the reactor. The closure of the slide valve is initiated by low pressure differential as measured across the valve by purged pressure instrument taps. The timing for the closure must be fast for it to be effective. To ensure the reliability of the pressure differential instrument reading, and to prevent nuisance trips, two-out-of-three voting by three separate instruments, each with dedicated taps, is recommended by Technip. Another measure to prevent nuisance trips is to use a pressure-differential controller which is provided to take over control and begin closing the slide valve when low dP is detected.
Although these features are critical for the safe operation of the FCC, they cannot be tested regularly without resulting in major upsets to operation. Additionally, the slide valves are functioning in a very aggressive environment and are prone to mechanical damage, which may result in their failure to close or inability to provide adequate seal when closed. Therefore, when the slide valves are asked to close, other actions should happen at the same time; for example, diverting feed from the riser. Ultimately, robust operator training and procedures are required to handle these situations in case the slide valves do not function properly. During every turnaround, the slide valve should be overhauled, and the emergency shutdown actions tested.
Year
2017
Process
Question 54: What recent innovations have you made to instrumentation that has application in FCC units?
FOOTE (CHS Inc.)
I will just share some of what we have done that has impacted and improved safety, reliability, maintainability, and operability in the last 10 years on our cat units. One innovation has been adding vortex and ultrasonic flow meters in slurry service. I think we have installed six in our main column bottoms circuits. The advantage of these flow meters is that they do not require any flush oil addition. We have seen good reliability and accuracy with them. We also found that the ultrasonic meters have a better turndown than, say, the vortex meters, but we have yet to inspect them after a five-year run. I suspect that they will look just fine, because they are still reading reliably. The second innovation we applied is smart accelerated valve positions. Having this feature has improved the control ability of our operations. ‘Position read back’, ‘advanced diagnostics’, and ‘partial stroking’ functions that we already discussed are the types of smart valve positions which are nice to have on control valves.
Next is electronic remote sensor or pressure differential transmitters. Traditionally, for pressure differential and reactor level, we have installed the dP transmitter above the highest tap and then run the impulse lines down to lower taps. Sometimes those impulse lines can be 100 feet long; some systems are longer. This application takes a different approach. It basically installs two pressure transmitters that are factory-matched and electronically linked. You put a pressure transmitter at your two taps, and those two are linked, which then provides your electronic remote sensor. We recently implemented the application on our reactor head and stripper project that will be installed this spring, and we have dramatically reduced the number of impulse lines running along the structure. We are excited to see the outcome. I believe there is another refiner who has done a similar application, too. I think those impulse lines really make me nervous when you are using small bore piping. If one of them comes loose, it could result in a bad situation. So, reducing small bore piping is a big deal to me.
Modern hydraulic power units for FCC slide valves: We talked about the benefits from a safety perspective. We have also seen a control benefit from the control systems on two of our units that we have modernized. The controllability of critical parameters around slide valves has really improved and made us able to operate our full-burn unit – in compliance for CO (carbon monoxide) – with a highly hydrotreated feed. It is also worth mentioning an automated UT (ultrasonic testing) inspection technique called AUT (automated ultrasonic testing). Your Inspection Group may refer to it as such. Basically, it is just an automated UT external inspection of pressure vessels that are online. It is limited to vessels that are 350°F or less, but we have been able to identify anomalies. It has really cut down our pressure vessel discovery work during turnaround and generated a big benefit to us in the last 10 years, in terms of value. We just do not have very many pressure vessel “Aha!” moments during turnaround anymore.
MALLER (TechnipFMC Process Technology)
As far as innovations in instrumentation, our standard on the reactor regenerator remains to be the purged pressure taps. So, nothing has changed there, and we do not really see anything new coming. The remote sensor mentioned by Mr. Foote is very interesting and could warrant further investigation.
For level instruments, we have seen guided-wave radar-type level instruments becoming more popular, particularly for interface level measuring. Nuclear-type level instruments have been applied in a main fractionator bottom service, and that subject will be talked about later in another question. Nuclear-type level instruments have also been applied to catalyst hoppers. It seems like it should be feasible to apply them for the reactor/regen level, but I am not aware of anywhere it has been done successfully yet.
Lastly, I agree with Darin’s point about the ultrasonic flow instruments applied in slurry service. I have seen those working well, and it seems to provide a good deal of improvement in terms of reliability.
BHARGAVA (KBC Advanced Technologies, Inc.)
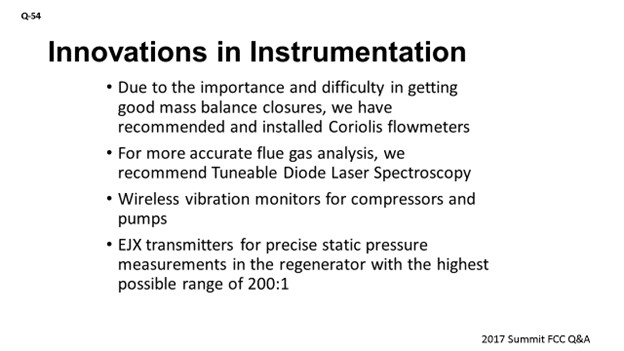
In addition to what the panel members just said, we have focused more on the data quality. From the perspective of monitoring the FCC, we think having good mass balance closures is most important. Good mass balance closure not only helps us monitor the unit; but when we do step tests or test runs, we are able to find small changes in the operation of the unit that help us identify the most profitable operation. We have installed Coriolis meters as a way to get better mass balance closures. In addition, we have started recommending and installing tunable diode laser spectroscopy meters for flue gas analysis. These meters allow you to improve the flue gas analysis composition detection into parts per billion, if needed. We have been looking for CO in very small levels, because knowing these levels helps improve the flue gas analysis.
From an equipment care and conditioning perspective, we are installing more and more wireless vibration monitors for compressors and pumps in the FCCs. And finally, Yokogawa has a list of EJX transmitters for pressure differential measurements. These transmitters are much more accurate than what you have in service today.
DAVE FERGUSON (Tracerco)
Sanjay, where are you installing the Coriolis meters?
BHARGAVA (KBC Advanced Technologies, Inc.)
The Coriolis meters are being put on the external boundary of the FCC to allow us to look at the feed meters, gasoline meters, and diesel meters to get the mass balance closures. These Coriolis meters are expensive, so you are better off installing them across the mass balance boundary.
PAUL DIDDAMS (Johnson Matthey)
I have a question for the audience. Is anyone using online feed analyzers these days? How many people are using an NIR (near-infrared), NMR (nuclear magnetic resonance), or some online feed analyzer? Is anyone doing that? None. Interesting. Okay. Thanks.
DARIN FOOTE (CHS Inc.)
In our FCCUs, we have employed a few noteworthy instrumentation advances that have improved safety, reliability, maintainability, or operability in the past 10 years.
-
Vortex and Ultrasonic Flow Meters in FCC Slurry Service: We have a combination of these our main column bottoms flow circuits. These meters have proven to be reliable and accurate and do not require flush connections like traditional orifice meters in slurry service. The ultrasonic flow meters have proven to be more accurate in low-flow applications. For vortex-type meters in horizontal mounting, applications ensure that the electronics are installed remotely or side-facing to ensure that the heads do not overheat from the hot process lines. For ultrasonic flow meters, pay close attention to the manufacturer’s insulation details for hot service.
-
Smart and SIL-Rated Valve Positioners: Position read back, advanced diagnostics, on control valves has improved control and reliability. SIL-rated positioners on SIS valves allows for partial stroke testing which can extend time between SIS testing intervals. This is important as we extend unit run lengths.
-
Electronic Remote Sensor Pressure Differential Transmitters: These are two matched and certified pressure transmitters that calculate pressure differential electronically as opposed to a single dP transmitter with impulse lines from two separate locations. This application has dramatically reduced the number of impulse lines on the FCC Rx/regen/stripper system.
-
High-Speed Pressure Transducers: Some operators have installed high-speed pressure transmitters in standpipes where fluidization problems exist. These transmitters are only used for short periods of time and typically do not send data to the plant historian.
ALEX MALLER (TechnipFMC Process Technology)
For level measurement, guided-wave radar level instruments have been gaining popularity and been successfully applied in numerous services, especially for interface levels. Nuclear-type level instruments have been more or less accepted in other processing units in refineries and have made their way into the FCCU for severe services, such as main fractionator bottoms level, and for hopper levels. Attempts have been made to apply the nuclear types of instruments to measure catalyst levels in the FCCU reactor or regenerator with varied degrees of success. On the structure, the standard for level remains dP-type instruments utilizing purged taps.
For flow measurement, ultrasonic type flow meters have been successfully applied in slurry service where a standard orifice plate-type instrument may face reliability issues. We have also seen ultrasonic flow meters successfully used for measurement of flow in flare headers.
SANJAY BHARGAVA (KBC Advanced Technologies)
Due to the importance and difficulty in getting good mass balance closures, we have recommended and installed Coriolis flowmeters. For more accurate flue gas analysis, we use Tunable Diode Laser Spectroscopy, wireless vibration monitors for compressors and pumps, and EJX transmitters for precise static pressure measurements in the regenerator, with the highest possible range of 200:1.
Year
2017
Process
Question 55: Given the expansion of the Industrial Internet of Things (IIoT), “Big Data”, cloud-based technologies, and advanced analytics, how are you applying these cutting-edge aspects into their work processes and toolkit to optimize FCC yield, reliability, and safety performance?
BHARGAVA (KBC Advanced Technologies, Inc.)
Some of the biggest challenges we have seen with “Big Data” revolve around security. Within the KBC software suite, we focus on security as our major differentiator. Given the connectors we have in The Cloud, we can now download the data from the refinery in a secure fashion and put it into one location; so, when people retrieve the data, they are all looking at one consistent set. That way, Yield Accounting is not looking at different numbers for closures from their perspective alone. The process engineer has his/her own mass balance that creates a lot of issues around the refinery.
The other big issue here is accessibility of the data: who inputs the data and who has the access to change it. All those issues must be addressed before you start using The Cloud to improve your data that is already on The Cloud. Because we are able to use this data and have access to lots of capacity, we are now able to micromanage, if you please, in terms of identifying and doing performance audits. We are even using this approach for shift performance information to see how one shift is doing against another. We can now get most of the information from The Cloud because we are able to store more data. This easy access to information has allowed simulation to move to a different level. We have been able to use the gobs of data we have from the DCS (distributed control system) to develop models that are more accurate. We can calibrate these models. In fact, in some of the real-time applications we have used, we have been able to calibrate the models on the hour. These models also allow us to set operational targets more accurately. That is about as far as we have gone with “Big Data”. So, it is all about finding your best possible operation and what you have done across the shift on a 24-hour average.
The benefits of having more data, sifting through it, and identifying good stable operation data to develop simulation models are all being used to generate LP (linear program) vectors, which are then used by the planners to help with crude selection and then do a gross optimization. From a yield perspective, it has definitely helped a lot. From a safety reliability standpoint, we now have enhanced unit monitoring. The old method of unit monitoring was to gather a number of KPIs (key performance indicators), have an operating range, and then try to optimize the unit in the operating envelope. We have used simulation as a way to help with some calculated variables that affected reliability of the unit. We have expanded the windows from operating envelopes to an integrity operating window to allow people to have a much better idea of or prediction capabilities on equipment failure.
Finally, having this data on The Cloud has allowed the SMEs (subject matter experts) from within the corporate level of the company to look at the same data set and help with the optimization of the unit from a remote location. You can also do this with third-party consulting companies to allow for another perspective with a fresh set of eyes to help make sure that the unit is running optimally on a daily basis.
SANJAY BHARGAVA (KBC Advanced Technologies)
With the advent of “Big Data” and cloud-based technologies, refiners are now able to harvest mega data in a process environment. Hundreds of thousands of values are being generated every few seconds to measure, monitor, control, and optimize plant operations. The major benefit of “Big Data” is to demystify the different plant data used by various parts of the organization by using with a common set of information that is utilized by all departments. In the modern refinery, the key is transparency in strategy, philosophy, and shared goals. The benefits are seen in reliability, safety, and operator consistency.
Also, refiners using in-house or third-party simulation technologies are able to extract precise information from these “lakes” of data about the performance and compare it to the best possible performance of the plant. Some companies are already tapping into this pool of information – through the use of simulations – to provide a robust means for selecting a set point or target setting of the independent variables.
The data is also being used in open-loop controls (and limited closed-loop controls) to help make advanced decisions to improve plant performance. The simulation models are being calibrated and updated to maintain prediction fidelity. The calibrated models are being used to generate LP vectors to keep the refiner’s planning models updated in order to mimic actual plant operation which will optimize feed and operating conditions, such as riser outlet temperature, feed preheat temperature, and main fractionator cutpoints in FCCs.
Advanced or enhanced unit monitoring applications are being used by refiners to convert raw data into key performance indicators. These applications are being linked to simulation technologies in real-time to generate calculated/derived key performance indicators focused on ensuring operation within integrity operating windows (IOWs) to help improve the plant reliability and safety and to maximize plant life by monitoring for corrosion, erosion, fouling, and accelerated mechanical equipment damage in order to allow for early action and prevention which will improve reliability and safety performance. These enhanced applications are also being used for predictive maintenance, as well as for monitoring the performance of operators between operating shifts and bringing shift performance closer to best possible operations, which will benefit all shift teams. These advanced unit monitoring applications, in addition to the cloud-based technologies with added security, are now being used by managers to view plant performance dashboards on their mobile devices. Finally, the data can also be used to perform remote monitoring by subject matter specialists – both within and outside of the organization – to optimize FCC operations. This monitoring can be now done due to enhanced security systems put into place to protect refinery data.
KATHERINE JONES (Honeywell UOP)
Honeywell recognizes the untapped potential of the industrial internet of things (IIoT) and sees these capabilities as the next revolution in industry:
-
IIoT enables users to leverage all data available including stranded data that, until now, has not readily used in business decisions.
-
Cloud-based solutions allows for a more collaborative environment to enable users to benefit from global expertise.
-
The use of big data and analytics, combined with the computing power of the Cloud, enables the investigation of large data sources and the discovery of new insights.
Maintaining high onstream efficiency and reliability are critical parameters for maximizing plant profitability. To help our customers maximize the use of their assets, Honeywell UOP offers a suite of cloud-based services with the Honeywell Connected Plant. One of these services, Process Reliability Advisor, combines plant data with UOP Process models that are tuned to current operation, plus a fault model which are cause-and-effect relationships and troubleshooting guides specific for the process. The service utilizes a cloud-based platform that supports big data analytics and machine learning to drive continual innovation.
Process Reliability Advisor enables our customer to:
-
Detect performance gaps early and perform mitigation steps,
-
Understand the unit’s current performance and asset utilization based on constraints, and
-
Promote learning and knowledge retention, leveraging UOP insights and context.
More information can be found at www.uop.com/cps including videos on how Process Reliability Advisor works.
Year
2017
Process
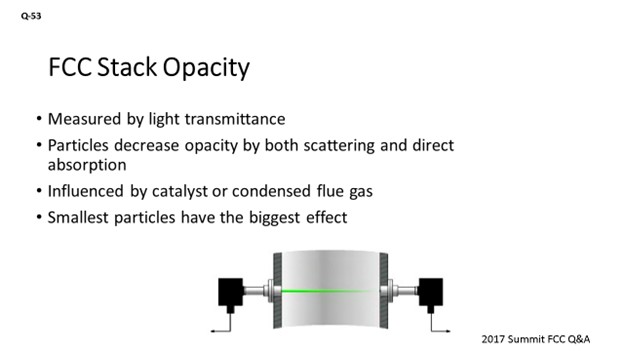
Question 53: What factors contribute to stack opacity? What options do you use for reducing stack opacity?
FEDERSPIEL (W.R. Grace & Co.)
Stack capacity is effectively a measurement of how much light is being blocked by whatever you are emitting out of your FCC stack. The particles that decrease opacity do so by either scattering the light or through direct absorption. Typically, those particles can either be FCC catalyst fines or condensed flue gas. My answer will focus primarily on those FCC catalyst fines/particles that get away from you and out of the stack. Because of the nature of absorption and scattering of light, the smallest particles in that 0.4-to-0.7-micron range – because they are similar to the wavelength of light – have the greatest impact on opacity. So, we look at those smaller fines.
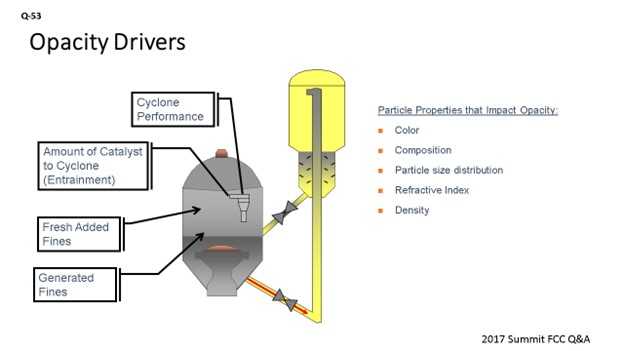
The way that we lose fines out of the FCC is really a marriage of the mechanical design, the way you are operating the process, and the specific catalyst you choose to put in. When you purchase your catalyst, it does contain some smaller fines particles. But typically, 1 or 2% of the inventory that the cyclones cannot retain will typically be lost to the stack. Fines you are generating in the unit also lead to stack losses. Several mechanisms could be contributing to that generation of fines. Then, there is the issue of how you operate the unit, in terms of how much catalyst you are driving to the cyclones. If you change your level up too high, you can certainly load your cyclones quite a bit more, although the efficiency might drop. Changing your velocity will certainly also have an impact. There are some additional details on the slide that show how the actual particle properties impact opacity.
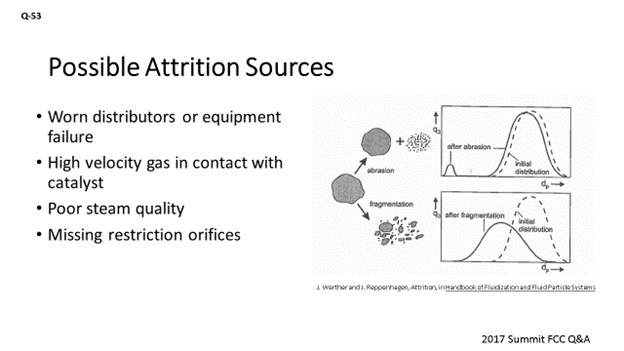
Within the fines generation piece of that puzzle, we can see different ways that the catalyst attrits. One of the mechanisms for attrition and formation of fines is the fractuating of catalyst particles where a particle breaks up into several larger particles. Abrasion is another mechanism. Abrasion is where the surface of the catalyst abrades off, leaving largely the original catalyst particle intact but forming a lot of the microfines, which are particularly bad for opacity. So, there are quite a number of possible attrition sources throughout the FCC. Some of these are inherent in just the operation or design of the catalyst in circulation, but we can certainly make changes that will worsen an existing problem.
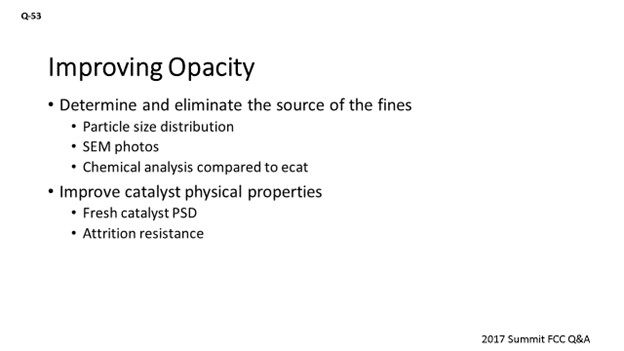
If we are looking to improve opacity, we could determine and eliminate that source of fines generation by using one of several available analytical methods to help us identify their origin within the unit. Are we seeing fracturing of particles or more abrasion of particles? We can use SEM (scanning electron microscopy) analysis, which can give you an idea of the shape of the particles. Certainly, looking at the particle size distribution analysis of both the e-cat (equilibrium catalyst) and the fines will give you really good clues. Lastly, examining the chemical analysis and comparing it to the e-cat will really show whether you are concentrating the fines up in surface contaminants.
Using those analytical methods, we can – hopefully – narrow down the possible causes of where we might be seeing attrition, like whether there is a high jet velocity somewhere in the unit that we might need to go investigate. Clearly, to mitigate the attrition, you can also improve your catalyst’s physical property. So, if you put a more attrition-resistant catalyst into your unit, you will expect to generate less fines. Certainly, shifting the fresh catalyst particle size distribution is another way you can help improve opacity. If you knew you had a cyclone loss issue and decided to shift the fresh catalyst particle size to a little coarser grade to avoid the small particles from being lost and recorded as opacity, then you can certainly do that.
TRAGESSER (KBR)
Mike covered attrition well, so I will not go over the information on this slide.
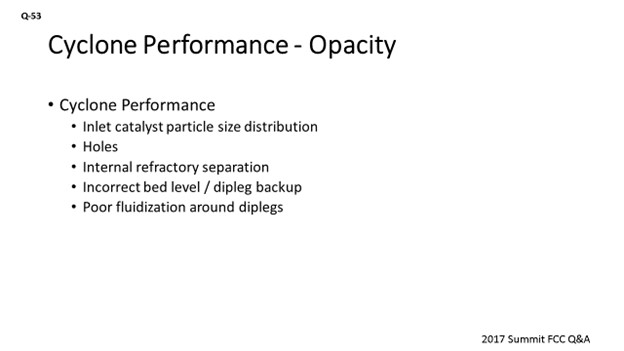
Cyclone performance is probably one of the primary factors that impacts opacity. There are a number of problems that can lead to reduced cyclone performance such as holes, incorrect regenerator bed level, or excessive cyclone velocity that can increase attrition and may also result in excessive catalyst backup in the dipleg. Refractory peeling away from base steel can lead to a catalyst loss problem. Air distribution problems in the regenerator can lead to a dipleg that is trying to discharge into a defluidized region of the bed.
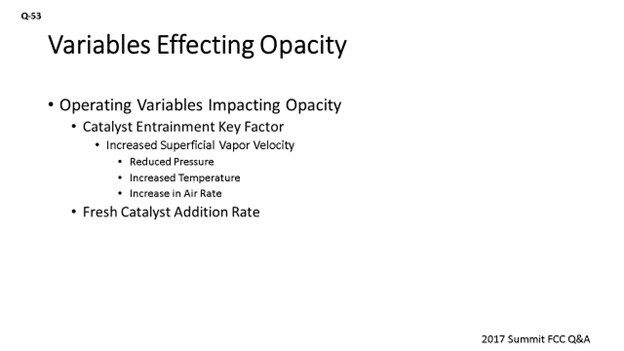
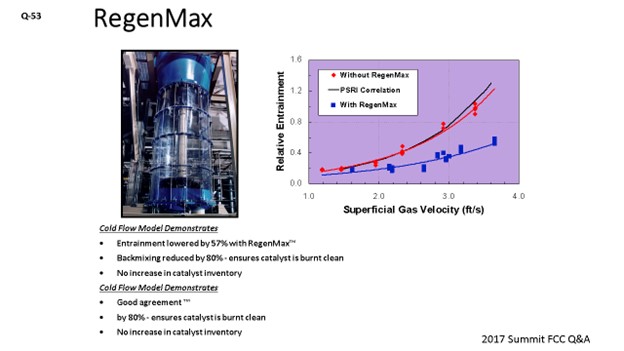
Catalyst entrainment to cyclones also directly impacts the catalyst loss through the cyclones, and the major variable that impacts entrainment is the velocity in the regenerator. So, anytime the air rate is increased, the catalyst loading to the cyclones is increased, thereby increasing losses.
KBR has a technology called RegenMax™ that reduces entrainment by about 50% for a given superficial velocity. This technology consists of a small layer of packing that is placed in the middle of the regenerator bed, which breaks up large bubbles that are formed as gas rises in the regenerator bed.
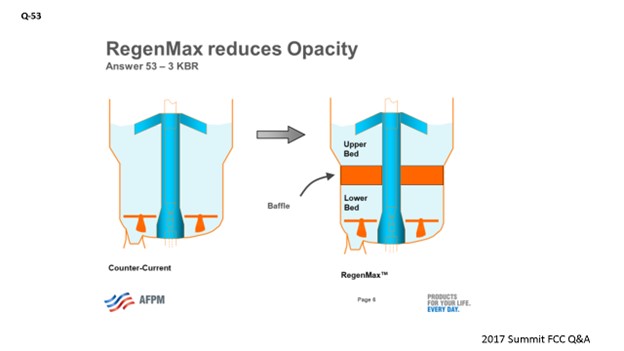
As with many inventions, this feature was actually a side benefit that was discovered during the development of RegenMax™. The primary purpose was to create a two-stage regeneration effect in a single-regeneration vessel by reducing the catalyst backmixing. I will talk about that effect more later.
DINKEL [Marathon Petroleum Corporation (MPC)]
I will just add a couple points from our experience. Over the past few years, we have utilized O2 enrichment, which supports the points the other panelists were making about reducing superficial velocity and entrainment. We have effectively used O2 enrichment as a handle to extend runtime and attempt to get ourselves closer to a plant turnaround cycle.
To add to Mike’s point about catalyst particles, we have also used the technique of classifying spent catalyst into a heart-cut on a unit with high losses to get rid of both the fines and the coarse particles, as well as to help improve the fluidization properties.
WARREN LETZSCH (TechnipFMC Process Technology)
When we talk about opacity, I can remember when 40 was a good number. Obviously, we were looking at a lot of catalyst going out the regenerator stack. And then, the rules got more and more stringent. When you guys get down to opacities of 3, 4, or 5 numbers like that, what is really the percentage of catalyst? How much of that is ammonium sulfate or something in the stack that is considered a particulate now because of the EPA (Environmental Protection Agency) measurements that you have to take into consideration? My point is that there is a limit of where you can probably go, as far as opacity, and it will not have anything to do with catalyst anymore. Let me ask you in a different way: If you know your opacities, do you know what percentage of it is catalyst and what percentage is other solids?
RIK MILLER (Phillips 66)
We have done some studies in units that use wet gas scrubbers (WGS) to remove SOx (sulfur oxide) and particulates from the flue gas stream. In those units, as much as 50% of the particulates in the stack were not actually catalyst. They were sulfates that were entrained from the wet gas scrubber. We found that the number of sulfates in the flue gas was proportional to the total dissolved solids in the circulating scrubber solution. I do not think there is much ammonium sulfate in the flue gas from a unit with an electrostatic precipitator (ESP) or a third-stage separator (TSS).
NIK LARSEN (Marathon Petroleum Company)
One aspect we might take for granted is actually making sure the opacity reading is real. So, chasing down issues like this, if you are chasing excess stack opacity, one of the things you might take for granted is the opacity analyzer is actually installed per your manufacturer’s guidelines. Right? So, how the analyzer is purged and with what media and making sure it is inserted properly can make a difference in your opacity readings, so they need to be checked if you are chasing down the excess stack opacity event.
RIK MILLER (Phillips 66)
At one of our refineries that operates with a TSS as its primary particulate removal equipment, we did a trial where we had the fresh catalyst classified to remove most of the 0–40-micron material. We had an outside vendor remove the 0-40 from about 12% down to 3%. Our stack opacity was cut by more than half – from 20 down to 8 – by removing most of the 0-40 from the fresh catalyst.
PAUL DIDDAMS (Johnson Matthey)
One additional thought to consider, if you have an ESP, is that the ESP’s efficiency may be impacted by ultra-low SOx levels. So, if you control your SOx levels to less than about 20 parts per million, you can end up with insufficient ionisable polar molecules and lose ESP efficiency. However, this efficiency can usually be recovered by re-optimizing the amount of ammonia used in the ESP. However, if the ESP efficiency is allowed to go down as a consequence of going to very low SOx levels, then catalyst losses will increase. This is another potential cause of increased opacity.
MICHAEL FEDERSPIEL (W.R. Grace & Co.)
Opacity measurements are influenced by particle density, particle refractive index, particle size distribution and particle color/composition. In this system, particles present are typically either catalyst particles which are not retained in the FCC, or condensed particulates from the combustion products that form due to local conditions. Particles decrease light transmission by both scattering and direct absorption. Particles with diameters approximately equal to the wavelength of visible light (0.4 to 0.7 µm) have the greatest light scattering effect and give the highest opacity1.
Stack opacity is primarily a function of the quantity and quality of the catalyst losses from the regenerator. Factors that influence catalyst losses (and stack opacity) include cyclone performance, the amount of catalyst entrained to each cyclone, fresh catalyst fines added, and fines that are generated in the operation of the FCC. Cyclone performance (including third-stage separators) is dictated by mechanical design and the physical condition of the cyclones, as well as unit operating conditions which include regenerator level, the actual air rate versus design, and the transport disengaging height in relation to the cyclone inlet. Unit operation also plays a part, along with catalyst properties, in the entrainment to the cyclones. While the fines added to the FCC are solely due to the fresh catalyst and additive particle size distribution, the fines that are generated are a function of the fresh catalyst and additives properties, the unit operations, and the mechanical design and condition of the equipment.
Fine catalyst particles (0-20 µm) are the most important variable in stack opacity. They are the fraction most easily entrained to the cyclones and most easily lost by the cyclones (Figure 1). They are formed during catalyst manufacture, from abrasion during in-unit circulation, and from fracture during in-unit circulation. Microfines less than 2 microns in size are of particular concern.
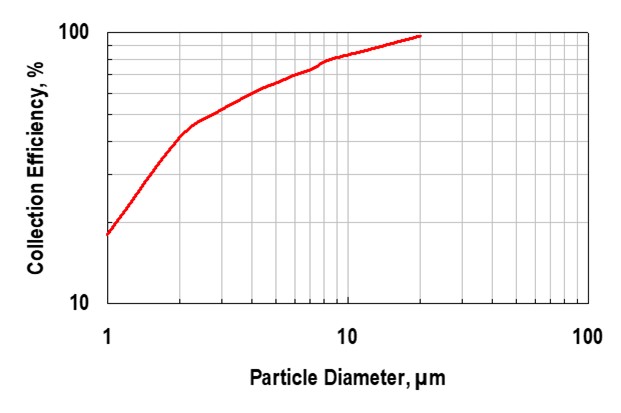
Figure 1. Cyclone Collection Efficiency2
There are several possible sources of attrition through the reactor/regenerator system:
-
A hole in the air grid or eroded nozzles,
-
Excessive dense bed velocity due to high air rate or low pressure,
-
Excessive cyclone inlet velocity,
-
High torch oil nozzle steam purge rate,
-
Steam condensate contacting the catalyst,
-
A tube leak in the catalyst cooler,
-
Excessive catalyst cooler fluidization medium,
-
Eroded or missing restriction orifices,
-
A hole in the stripper grid or steam ring,
-
A hole in the reactor dome steam line,
-
Wet stripping steam,
-
Open blast points or excessive aeration air or steam to standpipes,
-
Excessive lift media rates,
-
High instrument tap purge rate, and/or
-
Attrition in the catalyst loading lines because of excessive velocity, long distance, or tortuous path.
While excessive feed nozzle velocity – due to high steam rates or plugged nozzles – usually leads to a sharp increase in 1-micron slurry fines, some fines may make their way out of the regenerator and increase opacity.
There are a few methods available to determine the attrition mechanism for a catalyst or additive. Scanning electron microscopy (SEM) images of both the fines and the e-cat show the size and shape of the catalyst particles. The particle size distribution of the fines and e-cat can also provide some insight (Figure 2).
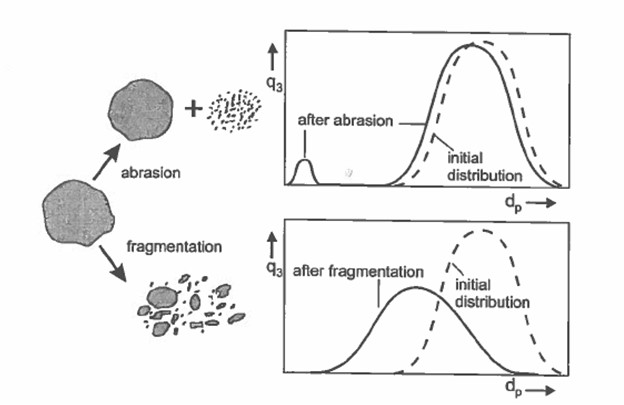
Figure 2. Particle Size Distribution of Different Attrition Mechanisms
Comparing the elemental analysis of the fines and e-cat can show whether the fines are concentrated in typical surface contaminants (nickel and iron), which could indicate abrasion as the attrition mechanism.
Catalyst type also affects attrition and opacity. The catalyst formulation, binder technology, and overall catalyst manufacturing process are all important factors in FCC catalyst attrition and stack opacity. Additionally, the morphology of the catalyst particle also plays a role because irregular particles are more likely to undergo attrition than uniform spherical particles (Figure 3).
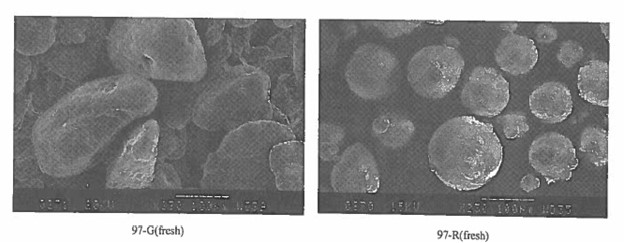
Figure 3. Morphology of FCC Catalyst of the Same Chemical Composition:
Sample 97-G on the left was twice as attritable as sample 97-R.4
By using catalyst and additives with better attrition resistance, stack opacity can be improved by reducing the generation of fines in the FCC unit. Eliminating attrition sources in the FCC unit, using the list above as a guideline, will also improve stack opacity, especially since the smaller fines generated through catalyst attrition have the greatest impact on opacity. Quickly repairing damage to cyclones and third-stage separators will eliminate high losses of larger particles from the FCC. Finally, by operating the FCC within design conditions, the risks of mechanical failure in the cyclones and velocity induced attrition are minimized.
BRYAN DINKEL [Marathon Petroleum Corporation (MPC)]
Opacity measurements can be impacted by steam, solids loading, or shifts in particle size of the solids to the stack. It is important to note that there is not a valid correlation between opacity and particulate matter (PM). Figure 53-1 illustrates that at the same opacity reading, there can be different PM rates due to the impact of particle size distribution (PSD) on the opacity analyzer’s light attenuation. For additional background and discussion on this relationship, refer to Ronald G. McClung’s article entitled, “Effect of FCC Catalyst Density and Attrition Index on Stack Opacity”5.
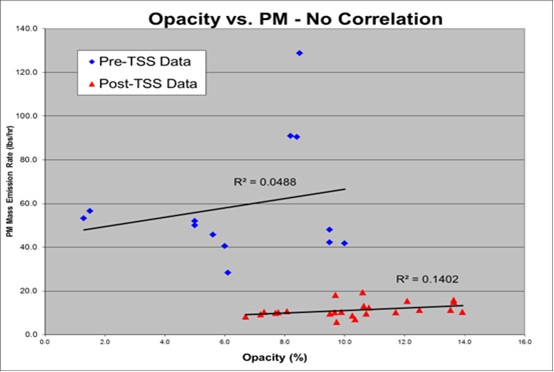
Figure 53-1. MPC Example Illustrating Opacity versus PM Relationship
The options available to reduce flue gas solids and impact stack opacity include modifying regenerator cyclones, installing/redesigning a third-stage separator (TSS) and electrostatic precipitators (ESPs), injecting ammonia to the flue gas upstream of the ESP, installing or modifying the wet gas scrubber, modifying the fresh catalyst particle size distribution to reduce solids losses, and making operational changes to reduce entrainment to the cyclones.
Marathon Petroleum Company has a mix of these control technologies across our system. We have observed positive performance improvements on ESP collection efficiency with the injection of ammonia. The slide below was presented during the 2014 Cat Cracker Seminar entitled: “FCC Environmental Control Technology: Reliability & Operation Discussion.” This slide shows a generic PFD depicting the available environmental controls. Most units will not have all of the components but will have a combination of technologies: cyclones, TSS, ESP, and wet gas scrubber.
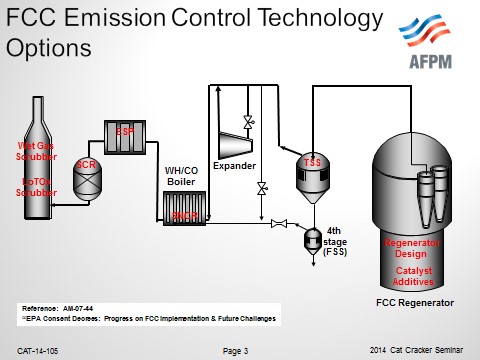
Figure 53-2. FCC Emission Control Technology Options
Regarding catalyst particle size distribution, we have made changes to fresh catalyst to a coarser grade material to aid in managing regenerator side losses. We have also purchased classified spent catalyst to supplement high losses on a unit that was a “heart-cut” material, targeting to minimize both fines and coarse content of the catalyst. Both of these classification options have been successfully implemented as part of solutions to reduce catalyst losses. On the same unit that used classified spent catalyst, we also utilized oxygen enrichment to minimize superficial velocity, minimize entrainment, and reduce catalyst loading to the cyclones.
SCOTT EAGLESON (DuPont Clean Technologies)
FCC regenerator flue gas stack opacity is typically associated with high particulate (catalyst fine) emissions. However, other flue gas constituents can also contribute to stack opacity and flue gas color. These include highly oxidized SOx and NOx (nitrogen oxide) compounds. Nitrogen dioxide (NO2) can appear as a yellow/brown haze. Sulfuric acid mist (H2SO4) can appear as a white/blue haze. Much depends on concentrations, stack diameter, exhaust gas flow rate and temperature, atmospheric conditions, sunlight, and viewing position. DuPont Clean Technologies has provided over 140 FCCU flue gas cleaning systems to minimize stack opacity using BELCO® EDV® Wet Scrubbing and SHELL third-stage separator technologies to meet extremely low particulate NOx and SOx outlets.
YORKLIN YANG (BASF Corporation)
Many factors can contribute to stack opacity. Catalyst physical properties and flue gas system design and operation are two important factors. The catalyst physical properties include:
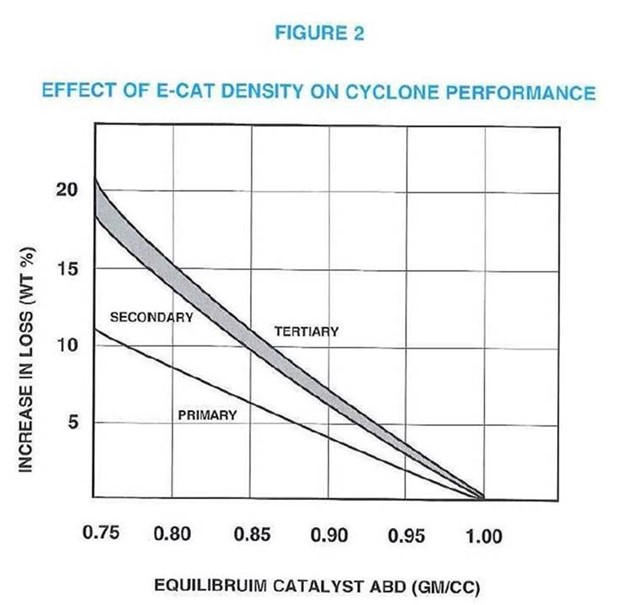
particle size distribution (PSD), particle density, apparent bulk density (ABD), catalyst attrition index, and catalyst fines PSD distribution in the stack. The chart below shows the effect of catalyst apparent bulk density (ABD) on cyclone performance: the higher the catalyst ABD, the less catalyst lost to the stack.
Below is another chart illustrating the effect of stack fines average particle size (APS) on opacity.

For a significant range of stack fines with average particle sizes of 4 to 11 microns, the capacity changes less than 3%. Above 11 microns, there is a more substantial decline of opacity due to less fine particles. It is found that FCC physical properties affecting opacity in decreasing order of importance are Catalyst Attrition Index, apparent bulk density (ABD), and particle size distributions.
The FCC flue gas system design and operation play important roles in reducing stack opacity. It is important to review operating conditions to check for a significant deviation from normal/original design, for example:
● Sudden vessel pressure loss,
● Regenerator bed de-fluidization due to low air rate, and
● Capacity creep.
Reactor cyclone flooding may be caused by:
● High velocity (higher feed rate, more gas, lower pressure etc.),
● High cat circulation rate, or
● High stripper level.
Regenerator cyclone flooding may be caused by excessive catalyst entrainment to cyclones from bed due to:
● High bed velocity, higher bed level, lower pressure, and lower density catalyst;
● High cyclone velocity (increased air rate, lower pressure, etc.), or
● High regenerator bed level.
Year
2017
Process
Question 61: When performing catalyst evaluations and considering catalyst resistance to attrition about particulate matter (PM) emission requirements, what new or advanced attrition testing methods are you using to predict the performance of the new catalyst system? Are there third parties who can conduct a standard testing regime to multiple catalyst systems?
FEDERSPIEL (W.R. Grace & Co.)
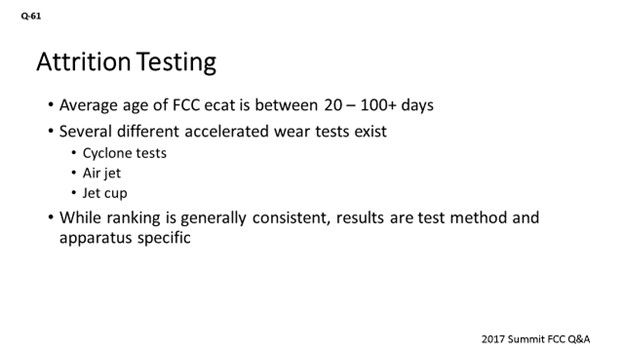
As I said earlier, the average age of FCC e-cat in a unit inventory is between 20 and 100 days. Clearly, there is a distribution of particles. Some are much newer; some are much older. So, it is not at all practical to mimic exactly what is going on in the FCC to judge how a catalyst might break apart. Therefore, we use an accelerated wear test as a proxy for measuring the probability of attrition on a catalyst. There are several different types of accelerated wear tests. There are cyclone tests, which are a more elaborate method because they do require a large quantity of catalyst. There is the air jet method. The primary mechanism for attrition there is particle-to-particle impact. And then, there is the jet cup method, which has both particle-to-particle and particle-to-wall effects.
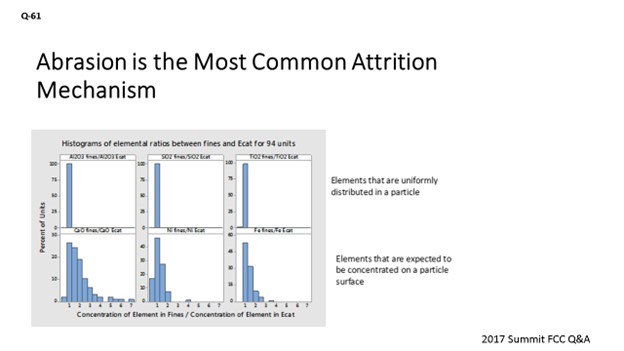
This next slide just shows the details about the most common attrition mechanism: abrasion. Using an accelerated wear test that simulates abrasion is a realistic method to pursue. The test procedure separates the elements that are uniformly distributed within the particle from those elements that are expected to be concentrated on the surface. The test method then compares the ratio between the fines and the e-cat for those elements. So, what we see is that elements which are concentrated on the surface are shown or overrepresented in the fines or they have a higher ratio in the fines. What that tells us is that the main attrition mechanism inside an FCC unit is driven by abrasion of catalyst particles. That makes sense, too, because fracturing has a higher energy requirement to fracture a particle than it does to abrade the surface.
Now I will talk really quickly about the different mechanisms. The jet cup, the air cup, and the cyclones will have similar rankings, but they will not have the same number scale. You do need to find a single laboratory to compare them, because the method – and even the apparatus used in that same method – will have an impact on the result you get for the attrition testing.
DINKEL [Marathon Petroleum Corporation (MPC)]
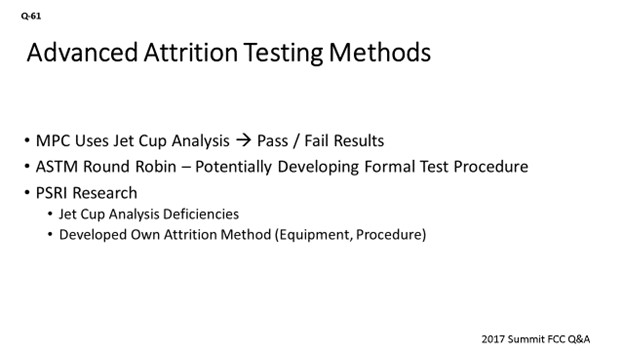
In an earlier response, I mentioned that we have our own pilot plant, so we do our own jet cup analysis via the original Grace method to supplement our activities there. We utilize a pass/fail test, which is a good indication of whether or not we will have circulation issues within the pilot plant. We have also used that analysis to help with troubleshooting on some of our commercial units in the past.
The second bullet point mentions ASTM (American Society of Testing and Materials) Round Robin tests for comparing the variety of different test methods utilized in industry. Our central lab participated in the test, along with approximately 10 different suppliers and independent labs. We know what Grace uses from Mike’s response. BASF and Albemarle utilize different equipment and test methods than Grace and each other. PSRI (Particulate Solid Research Inc.) has also done testing on the jet cup. In their research, PSRI found some issues with attrition not being quite as reflective as they would have liked to have seen. As a result, PSRI developed their own test method, including equipment and procedures. The end goal is the analysis of all of this data from this ASTM study to see if ASTM can possibly come up with a standardized test.
The last part of the question is about independent labs for testing. I mentioned PSRI. As a member company, we have access to their attrition testing findings. PSRI also conducts contract research, so they are one option for independent testing. CPERI (Chemical Process & Energy Resources Institute) in Greece does independent testing. Cat Testing Labs in Savannah is another option that would allow you to evaluate catalysts from different suppliers and have an independent view of the test results.
RIK MILLER (Phillips 66)
Phillips 66 operates a standard jet cup test to measure catalyst attrition. About 12 years ago, we became very interested in not just measuring the attrition indices of catalysts, but also measuring the particle size distribution of the attrited products. It was very important for us to know not just how much of a catalyst broke up, but also what it broke into, because flue gas particulate capture equipment varies in efficiency. So, we began to analyze the attrited products from the jet cup test to determine their particle size distribution, and we found significant differences from one catalyst to another. The catalysts might have the same attrition index but produce a very different attrited particle distribution. We found the results of this test to be very important as they were predictive of the performance of catalysts in our commercial units.
MICHAEL FEDERSPIEL (W.R. Grace & Co.)
A number of operating factors influence catalyst losses from the regenerator that can lead to particulate matter (PM) emissions. These factors include: the number of fines present in the freshly added catalyst, the number of fines generated in the unit, the amount of catalyst transport to the cyclones by entrainment, and the cyclone performance. Fines are the most important factor in catalyst losses, because the fines are most readily lost by the cyclones and the collection efficiency of cyclones drops as particle size drops. FCC catalyst fines (0-20 micron) can come from either fresh catalyst that is added to the unit or be generated via attrition while the catalyst circulates in the unit. Catalyst can experience attrition in the unit from either fracture (catalyst breaking into smaller fragments due to severe impact of the particle against a solid surface, severe impact against other particles, or impact from a jet of steam or air) or due to abrasion were rubbing against a solid surface or other particles erodes the particle at the outer surface and produces fines. Abrasion has a lower threshold energy than fracture18. While both fracture and abrasion occur in FCC units, abrasion is the dominant mechanism of fines generation in most FCC units. The evidence for this is that the fines for most units are enriched in surface contaminants such as calcium, iron, and nickel. If abrasion is the dominant mechanism, one would expect fines to be enriched in surface contaminants; while if fracture were the dominant mechanism, one would expect the fines composition to be the same as the bulk e-cat. Figure 1 presents data for 94 units where the concentration ratio of an element in fines versus e-cat is presented. As seen in the graph, there is no enrichment in fines in elements that are uniformly distributed in a particle (such as aluminum, silicon, and titanium), but there is strong enrichment of the fines of many units in the surface contaminants such as calcium, nickel and iron.
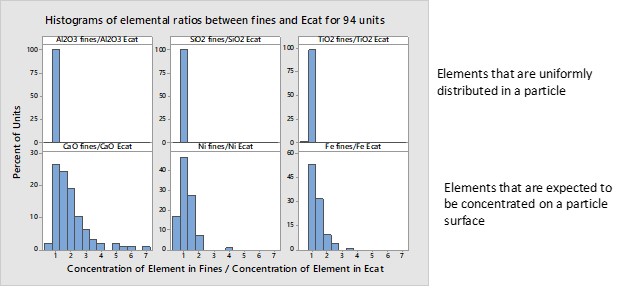
Figure 1. Abrasion is the most common mechanism, based on evidence that fines for most units are enriched in surface contaminants such as Ca, Fe, and Ni.
There are a variety of lab methods that have been used to simulate – in the lab – the particle attrition that occurs in a commercial unit. They all involve subjecting catalyst to more severe attrition than is experienced in a commercial unit. One sophisticated method involves passing the catalyst through a series of cyclones at high velocity19. These cyclone tests provide insight into attrition fundamentals, but the large amount of sample required, and the long testing times prevent their use for routine testing of catalysts for attrition. The most common test methods for routine catalyst testing are methods based on the air jet and the jet cup. In both methods, the catalyst is subjected to a high-velocity air stream, which results in fines generation. The number of fines generated is a measure of the attrition resistance of the catalyst. In the air jet method, most of the collisions are particle/particle; while in the jet cup method, both particle/particle and particle/wall collisions occur. Examples of attrition testing equipment based on the air jet method are ASTM D575720 and the designs of Forsythe and Hertwig21 and Gwyn22. Examples of attrition testing apparatus based on the jet cup method include the Davison Index (DI)23,24 and jet cup equipment developed by PSRI25 and other labs26. There are several jet cup designs reported in the literature. It is important to note that the dimensions, volume, and configuration of the jet cup all play a role in its performance and that some jet cups – described as “Davison-type” jet cups – are not the same as the jet cup used in the Davison Index test method practiced by Grace.
We are often asked how jet cup methods compare to the ASTM D5757 air jet method. Attrition resistance measured by ASTM D5757 (an air jet method) and by Grace’s DI test (a jet cup method) give comparable results in that lower values on each scale are more attrition resistant. It is not possible to directly correlate the scales of the two tests since they are different apparatus, but they tend to give values of the same order of magnitude. In round robin testing with an external lab, Grace found that those two methods gave the same ranking regarding catalyst attrition27. Similarly, a recent paper by Kukade, et. al.28 found that the performance ranking of catalysts did not vary between ASTM D5757, a cylindrical jet cup, and a conical jet cup. While the methods give similar rankings, it is important to remember that their scales differ; so, testing with the same method is necessary for an “apples-to-apples” comparison between catalysts.
For third-party testing of catalyst systems, we are aware of two organizations that conduct this testing: CPERI (Chemical Process & Energy Resources Institute) and PSRI (Particulate Solid Research Inc.)
BRYAN DINKEL [Marathon Petroleum Corporation (MPC)]
MPC uses a jet cup analysis to evaluate catalyst attrition. Testing follows the original Grace Davison procedure and generates a Davison Index (DI) value. MPC uses the jet cup analysis as a pass/fail test. Fresh catalyst samples possessing a DI value of less than 10 pass the test, while samples showing DI values greater than 20 fail. FCC e-cat (equilibrium catalyst) samples have DI values below 2, while fresh catalyst samples typically have DI values between 3 and 10. Samples that fail the attrition test are flagged for further testing. Commercially, we have encountered opacity problems when catalyst samples consistently fail the attrition test.
Each supplier has different equipment and/or conditions for testing, which makes it difficult to compare results from the different suppliers. ASTM D32.02 is developing a formal test procedure for the jet cup (WK34893), which may lead to a standard test.
As members of Particulate Solid Research Inc. (PSRI), we are aware of some of the deficiencies of the traditional jet cup test identified through their research efforts, which have included CFD modeling and high-speed video with a Plexiglas apparatus. PSRI used this information to develop its own testing equipment which can be used for membership testing or on a contract basis with individual companies. Additional information on this test equipment can be found in the article entitled “Jet Cup Attrition Test”29. In addition to PSRI, CPERI and Cat Testing Labs Inc. are other independent testing labs that can provide subjective testing when comparing catalyst options from multiple suppliers.
MELISSA CLOUGH (BASF Corporation)
There are many test methods available to evaluate attrition resistance, each with pros and cons. The best test method will meet the following criteria: It 1) is able to match the unit’s attrition profile, either predominantly abrasion or fracture, 2) is standardized and repeatable so that data are comparable, and 3) matches the FCCU’s overall material loss over the test period. The most common methods include the ASTM Air Jet, DI Jet Cup, and PSRI Conical Jet Cup. The Air Jet is the only ASTM-certified test method and thus represents the most standardized and repeatable test available. Air Jet also is predominantly abrasion (breakage into little particles from the surface of a catalyst particle) as opposed to fracture (e.g., breakage in half). An assessment of over a dozen refinery FCCU attrition mechanisms via population balance modeling indicates that the majority of attrition happening in the unit is via abrasion. Thus, Air Jet is both standardized and represents the majority of the attrition mechanism that can be seen in an FCCU. Air Jet can also mimic material loss of an FCCU over the test period. The DI Jet Cup method is predominantly fracture. Further, the mass loss is heavily hindered due to stagnation of material in the bottom of the cylindrical cup. Therefore, the majority of the catalyst is not being tested during the one-hour duration. The PSRI Conical Jet Cup improved on this by changing the shape of the holding vessel, which removes the stagnation problem. Third-parties available for this type of testing include PSRI in Chicago and CPERI in Greece.
Year
2017
Process
Question 62: Do you know of factors that are likely to lead to deposit formation on power recovery turbine blades? Is there anything that can be done to prevent these deposits from laying down on the blades? Once the deposits have been formed, what are the consequences and is there any way to remove the deposits online?
BHARGAVA (KBC Advanced Technologies, Inc.)
In summary, it is all about turbine blade deposition in the expander on the flue gas. First, I will talk about the causes, catalyst loading being the number one and the only cause for most of the turbine blade deposition. The catalyst loading on the flue gas inlet is what determines the amount of deposition. From a mechanical standpoint, the blade deposition increases as the performance of a third-stage separator goes down – for whatever reason – or the loss in regenerator cyclone efficiencies. From a catalyst perspective, if you are trying to put in a new catalyst, that catalyst will have different attrition properties. Evidence of mechanical damage in the unit that results in more catalyst fines will have the same effect. Increasing fresh catalyst additions will produce the same result, because fresh catalyst contains more fines. Also, as you start processing resid or heavy metal gasoil and your sodium and vanadium levels go up, the catalyst will start to get stickier and will create eutectic mixtures at certain temperatures, resulting in more catalyst sticking on the blades. From an operational standpoint, if you increase flue gas rates when you increase air rates, the amount of catalyst loss through the cyclones will increase and result in more deposition.
At some sites, we found additional steam being injected upstream of the expander, a practice that is done for different reasons. One reason could be to maintain temperature and pressure on the inlet of the expander in order to keep up the efficiencies, but that is not a recommended solution because it actually makes the situation worse on the turbo expander. So, those were the causes.

What is mitigation? It is important to understand the cause of the depositions. You want to make sure you analyze the deposits. If you do not have that luxury, then track the 20-microns or less size range, the catalyst’s physical properties, and monitor the e-cat metals. From a mechanical perspective, you want to do a routine monitoring of the bearing temperatures and vibration, and then check the process temperatures and pressures to identify if you are having a problem. One option to help reduce the turbine blade deposition is to run close to the design temperature and pressure.

Consequences: These are obvious consequences. You lose power generation efficiency, but more serious are excessive depositions. If you have deposition on the blade and have uneven breaking off the deposits, the expander can become unbalanced, which goes back to the previous point about monitoring vibrations for early detection. How do people remove the deposits? First, you need to monitor the deposits via a viewport using a strobe light. This light will allow you to quickly detect the buildup of deposits. This monitoring is more important because if the deposit just builds up, it will be easier to remove the deposits. You can even do that with an online riser walnut shell cleaning. Some people have resorted to thermal cycling by bypassing the expander. Again, that is also a thermal shock to the unit, so we do not recommend it. Finally, if the deposits have been there for a long time, you do not have any choice but to shut down the expander.

FEDERSPIEL (W.R. Grace & Co.)
Like what was previously mentioned, some of the hard deposits that may form on the expander blades might consist of fine catalyst particles but may be enriched with other contaminants like sodium, potassium, calcium or chlorides, vanadium, iron, and other trace elements. The theory is that they might form a eutectic that drops out on areas of high velocity and pressure drop. It is a little counterintuitive; but the expander, of course, is one such place. Further, if you build up the deposit to a sufficient thickness where it starts to cause friction on the machine, those deposits can then be enriched with the expander metallurgy. And if they get hot enough, those deposits could then sinter and be very hard to remove.

So, one of the key takeaways is to send in the deposit for analysis. We can do chemical analysis and look at what material is actually there. There are more advanced techniques as well, like microprobe or line scanning, which can tell us where the different elements are lining up in that deposit or how they are formed over time. Even SEM (scanning electron microscopy) and X-ray diffraction can look at not just the shape of the deposit but can also identify crystal structure.

PUI-NANG LIN [Flint Hill Resources (FHR)]
Another area we found very important for the expander fouling is the quality of your expander cooling and impingement steam. That is another source of sodium that can accelerate the blade deposits.
ALEXIS SHACKLEFORD (BASF Corporation)
Another element you should look for is sulfur. Sulfur is often enriched in these deposits. Occasionally, you may also see evidence of refractory in these deposits. Please see BASF’s response in the Answer Book that shows you what these deposits look like compared to e-cat and compared to fines samples.
MELIKE YERSIZ (Chevron U.S.A., Inc.)
How often do you recommend inspecting the blades with the strobe lights?
BHARGAVA (KBC Advanced Technologies, Inc.)
If you have a viewport in a strobe light, then you should be routinely monitoring the blades once every couple of weeks, depending on the severity of the situation. You can then increase or reduce the frequency, depending on how your deposition goes.
FEDERSPIEL (W.R. Grace & Co.)
When I worked at Hovensa, we would do it weekly. We often found out that staying ahead of the problem was a lot easier than trying to address it after it became an issue. So, if you have the facilities there that look to the viewport or take the pictures, it is probably easiest to set it up on a regular basis – like on Saturday – just to have the Inspection guys go out, take the pictures, and monitor it.
PHILLIP NICCUM (KP Engineering, LP)
I want to make a reference to a paper written by David Linden with Ingersoll Rand back in the 1980s. The topic of the paper was the composition of these deposits. It is a seminal work on this subject, and I recommend it. In the paper is a reference to tables of these eutectic mixtures, and I have some of them. It is pages and pages of eutectic mixtures with many elements from FCC with which you are very familiar. It is quite a useful reference.30
BOB LUDOLPH [Shell Global Solutions (US) Inc.]
Calcium and iron also play into those eutectics as well and can have a dramatic effect. As far as the sodium goes, make sure your desalter is being checked for its effectiveness, because a dramatic shift in its performance could really result in a much larger change in the expander operation.
SANJAY BHARGAVA (KBC Advanced Technologies)
Deposit formation is usually linked to catalyst depositing on the turbine blades. The deposits are mostly a function of catalyst loading of the inlet flue gas. An increase in catalyst loading could be due to several factors, including performance of the third-stage separator, loss in cyclone efficiency, change in catalyst attrition properties, excess fines in fresh catalyst, an increase in fresh catalyst additions, and/or an increase in flue gas rates due to higher air rates.
In addition, KBC has seen locations where steam is introduced between the regenerator outlet and tunable diode laser spectroscopy third-stage separator. The addition of steam is used to control the temperature within the guidelines of the expander. The use of steam and the added “humidity” increase the deposition potential of the catalyst on the blades. Further, high levels of sodium and vanadium on equilibrium catalyst can also form a sticky, eutectic mixture which would tend to stick to the blades more easily and lead to accelerated deposition rates.
Rigorous monitoring of catalyst balance and fines generation – specifically, sub-20-micron particles – helps us understand the deposition rate on the blades. Minimizing deviations from design pressure and temperature also helps reduce the rate of deposition. Monitoring catalyst physical properties and Na/V (sodium/vanadium) to ensure good cyclone efficiencies is as important. Early or regular action to correct the deposition problem by routine monitoring of bearing temperatures and vibration, along with process temperature and pressure, will provide the required information for corrective course of action.
Deposits can be monitored via a view port with a strobe light to allow weekly photographing of the blades. This information can then be used to establish the frequency of regular online cleaning of the blades. Cleaning can be done with rice, walnut shells, or a less preferred method of thermal cycling of the turbine by partial bypassing of the flue gas to cool down the blades. If the deposits are allowed to build up over extended time periods, online cleaning is not recommended as chunks of deposits are likely to be removed non-uniformly, which can unbalance the blades and result in excessive vibration.
MICHAEL FEDERSPIEL (W.R. Grace & Co.)
The paper, “Catalyst Deposition in FCCU Power Recovery Systems” by David H. Linden31 at Ingersoll-Rand, refers to four types of deposits that occur in flue gas lines, equipment, and power recovery turbines. The first type (A) are powdery catalyst deposits that cling to surfaces in the flue gas train. The second type (B) occurs when those powdery catalyst deposits get wet and then harden after drying out. Upon analysis, these deposits appear similar in chemical makeup to equilibrium catalyst or third-stage separator fines.
The third type (C) of deposit is made up of very small catalyst particles, along with elevated levels of alkali metals (sodium, potassium, and calcium), chlorides, vanadium, and iron, as well as other trace contaminants from unique or challenging feedstocks. It is theorized that these contaminants form a low melting point eutectic. These deposits are very hard and are often found in areas of high gas velocity and pressure drop, and the expander is just such a place. If these deposits form along the expander blade tips to sufficient thickness to cause rubbing, the friction will increase the temperature enough to sinter the deposit into a new type (D) of deposit which has increased metals content from the expander metallurgy.
By reducing catalyst traffic to the flue gas and preventing condensation, these types of deposits can be minimized. Keeping the regenerator cyclones and third-stage separator mechanically healthy and operating within design specifications will help. Ensuring catalyst coolers are leak-free will prevent boiler feed water chemicals from further contaminating catalyst and eliminate an attrition source. Running the expander at design conditions can keep the flow path through the expander fully developed, thus mitigating eddy currents and dead spaces. Suppressing the contaminant metals (particularly those that accumulate on the surface of the catalyst particle and then abrade off) or using a catalyst with a low attrition tendency can help to reduce blade depositions. There are also several options for expander coatings which can reduce or prevent the accumulation of deposits.
Monitoring deposits during the run can help a refiner be prepared for work that needs to be done during the next available outage. Taking pictures through view ports and vibration monitoring are two common methods used to quantify and track deposit formation.
Once formed, deposits can cause loss of expander efficiency and threaten the mechanical integrity of the machine, as well as force a shutdown due to high vibrations. While these deposits can be removed through the injection of walnut shells or rice, a regular program aimed at preventing the formation of deposits is generally more effective at achieving longer run lengths than attempting to fix a vibration issue after it develops. Varying the size of the media can help reach the different places these deposits form. Other methods include thermal shocking or thermal cycling of the expander, which takes advantage of the different thermal expansion coefficients of the deposits and the turbine metallurgy to release accumulated deposits from the surface of the blades.
ALEX MANNION (BASF Corporation)
Below are deposit examples from a cyclone and expander blade. Typically, these deposits are rich in elements such as Fe (iron), Ca, Na, Mg and S. These elements can act as a “glue,” binding catalyst fines together.

Factors that could lead to deposit formation include high catalyst attrition, high catalyst losses from cyclones, poor water quality being used from steam injection, water condensation and precipitation at cold spots, and high metals content in the FCC feed.
Several measures can be taken to avoid deposits from laying down on the blades. To minimize fines generation, an attrition-resistant catalyst can be used, and fresh catalyst additions should be minimized. Also, all steam ROs (restriction orifices) should be in place, and excess velocities should be avoided. High-quality water should always be used while minimizing water injection, when possible. “Cold spots” in the overhead line or expander should be avoided. Crude desalting additives can be used to minimize metals (e.g., Ca) in the feed. Finally, effective soot blowing of CO boiler tubes can mitigate deposit formation as well.
Deposits can lead to expander vibrations and blade erosion, potentially leading to catastrophic equipment failure. If deposits have begun to form, regular walnut shell cleaning can be conducted and thermal spalling if required.
Year
2017
Process